


Sign up for the monthly RVAgreen 2050 newsletter here.
Call us at (804) 646-6957
Email us at [email protected]
![]()
![]()
![]()
![]()
What is a Climate Vulnerability and Risk Assessment?
The City of Richmond worked with Planning Communities LLC to prepare a Climate Vulnerability and Risk Assessment to evaluate heat and flooding risks to Richmond communities, built assets, and natural features. The Assessment report documents the data-driven, science-based, and collaborative process used to assess climate vulnerability and risk; explains the processes and data used to assess social and physical vulnerabilities and risks; summarizes and prioritizes the risk and vulnerabilities to communities, natural, and physical assets; and provides a basis for integrating climate risks and vulnerabilities into the RVAgreen 2050 initiative.
Why is the Assessment Important?
Richmond communities are facing more extreme heat waves and flooding from storms due to climate change, and the City's most vulnerable communities are bearing the brunt of these climate impacts.
What Resources About the Assessment Are Available?
Resources available to help understand climate vulnerabilities and risks to Richmond communities and the assessment process include:
- The Assessment that evaluates heat and flooding risks and vulnerabilities to Richmond communities, built assets, and natural features in Richmond.
- A storymap that illustrates risks and vulnerabilities in Richmond. Explore maps showing heat and flooding climate risks, social vulnerability, built and natural assets, and priority planning areas in Richmond.
- A video series that provides an overview of climate risks and vulnerabilities, how the RVAGreen process integrates community priorities and equity, how the Climate Vulnerability and Risk Assessment was prepared, and its role in resilience planning.
- Video 1: What is RVAgreen 2050?
- Video 2: What are the community's priorities?
- Video 3: Climate Vulnerability and Risk Assessment
- A handout that summarizes the Climate Risk and Vulnerability Assessment.
Switch Together Richmond
We launched Switch Together to help you understand your solar options and save money. Switch Together Richmond is open for registrations. Join our newsletter to receive more Switch Together updates.
Richmond is pleased to support this program, which helps homeowners and small businesses secure a quality rooftop solar installation. The program also offers discounted prices for optional add-ons such as battery storage, and electric vehicle chargers.
Using group buying and the expertise of nonprofit Solar United Neighbors, Switch Together ensures that participants get a great deal and have the information needed to make an informed decision.
How does Switch Together work?
Switch Together organizes groups of residents who are interested in going solar, together. By organizing a group purchase for solar panels, Switch Together can get a better deal for everyone in the group.
{"preview_thumbnail":"/sites/default/files/styles/video_embed_wysiwyg_preview/public/video_thumbnails/T4tpD9slqvY.jpg?itok=1jflNPqp","video_url":"https://www.youtube.com/watch?v=T4tpD9slqvY&feature=youtu.be","settings":{"responsive":1,"width":"854","height":"480","autoplay":0},"settings_summary":["Embedded Video (Responsive)."]}
SolarizeRVA
As part of RVAgreen 2050, the City of Richmond is proud to be a recognized SolSmart Gold community. SolSmart is a national program designed to assist and recognize communities that foster the growth of strong local solar markets by taking key steps to reduce barriers and make it faster, easier and less expensive to go solar.
The City of Richmond, through the Office of Sustainability, has partnered with Viridiant, Solar United Neighbors, and Henrico County to launch SolarizeRVA, a campaign to help the greater Richmond region transition to clean solar power generated right here in our community. Learn more.

Solar Projects - Permits
Permit Applications
For residential or commercial solar projects, applicants should use the Electrical Permit Application. If your permit application requires a plan submission, you must use a thumb drive or CD. No paper submissions will be accepted. As a SolSmart Gold designee, the City of Richmond is committed to providing a timely review of solar PV permit applications. Timelines & details are on the Permits & Inspections webpage.
Application Checklist
For helpful information, refer to the Electrical Handout Checklist and the Electrical Plan Review Requirements.
Permit Fees
Refer to the Permits Fee Schedule for the electrical permit fee. It is based on the cost of the solar PV system.
Submit Permit Application
To file the permit application, submit your information and payment in person at the City's Bureau of Permits and Inspections, City Hall, 900 E. Broad St. Hours: M-F 8:00 a.m.- 5:00 p.m. Call (804)646-4169 with questions.
Solar Projects - Zoning
Permitted Accessory Use
In the City of Richmond, property owners are able to install solar panels as an accessory use on the property in all zoning districts. Solar panels are considered an accessory use and relevant setbacks will be imposed. The City of Richmond allows solar panels as accessory mechanical applications (just like an A/C unit or something similar) in the side yard or on the roof.
Accessory structures cannot be in the front of a dwelling (in the front yard) and, for this reason, would not be permitted at that location if it was the only viable location to access the sun. In these situations, it is possible to seek special approval from City Council.
Advisory Determination: Accessory Uses Solar Panels
This Letter of Determination clarifies that solar panels are an accessory use to a permitted primary use building or structure and permitted by right in all zoning districts.
Accessory Use Definition
Per Zoning Sec. 30-1220, accessory use means a use of land or use of a structure or building for purposes incident and subordinate to the principal use of the premises.
Old and Historic Districts
For property within the city's Old and Historic Districts, a Certificate of Appropriateness from the Commission of Architectural Review is required for any exterior changes including the installation of solar panels that are visible from a public place or a public right of way which includes streets, sidewalks, and alleys.
The Commission has guidelines for the installation of solar panels in Chapter 3 of its Handbook and Design Review Guidelines for Old and Historic Districts of Richmond Virginia which emphasize locating the panels to be minimally visible from the public right of way and installing the panels in a method that is reversible and does not compromise the historic integrity of the structure or the historic district. (See Chapter 3, Building Elements, Roofs)
Information about the guidelines, the application process, and how to determine if a property is within a City Old and Historic District can be found on the Commission of Architectural Review website.
Special Use Permit Required
If solar panels are providing off-site power, they are not considered an accessory use. In that situation, a special use permit is required. For more information about the special use permit process, go to the Land Use Administration website.
Solar Potential
Find the Solar Potential for Your Home or Property
Estimate the performance of potential PV projects
Solar At Home
Find solar consumer protection resources and information
Learn more about no cost, no obligation solar options for your home
Learn about solar financing options and incentives for your home
- Homeowner's Guide to Solar Financing
- SolarizeRVA
- Virginia Solar United Neighbors (VA-SUN)
- Energy Incentives - Virginia Division of Energy
Solar At Work
Learn more about solar options for your business
Learn about solar financing options and incentives for your business
Solar In the Community
Richmond is experiencing higher average temperatures and more extreme heat waves due to climate change.
Learn more, stay cool, and stay safe with the resources below.
What is an urban heat island?
An urban heat island (UHI) is an urban area that is significantly warmer than its surrounding rural areas. Modified land surfaces (paving, sidewalks, streets, etc.) in the urban environment retain heat and are the main cause of UHI.
In Richmond, the UHI is strongest in the summer months. When combined with summer weather, the UHI can create periods of extremely high temperatures and humidity levels that have serious health impacts on vulnerable members of our community (people with asthma and pulmonary conditions, the elderly, etc.). As extreme heat events increase with climate change, the urban heat island is projected to intensify.
How do higher temperatures from urban heat islands impact our community?
- Negatively affect our health and comfort
- Elevate level of air pollutants and greenhouse gas emissions
- Higher energy bills
- Increase energy consumption in buildings
- Impair water quality
What can you do to reduce the impact of UHIs?
- Plant trees or care for trees in your neighborhood
- Install a vegetated or green roof
- Create a green space on vacant land or help maintain an existing green space
- Install permeable surfaces on roadways, sidewalks, parking lots, and alleys
How is the City of Richmond working to reduce urban heat?
Mapping Urban Heat Islands
In summer of 2017, the City of Richmond partnered with the Science Museum of Virginia, Virginia Commonwealth University, University of Richmond, and Groundwork RVA to enhance awareness and understanding of the urban heat burden in Richmond and develop ways to reduce UHI-related impacts. We are focusing on underserved neighborhoods of the community.
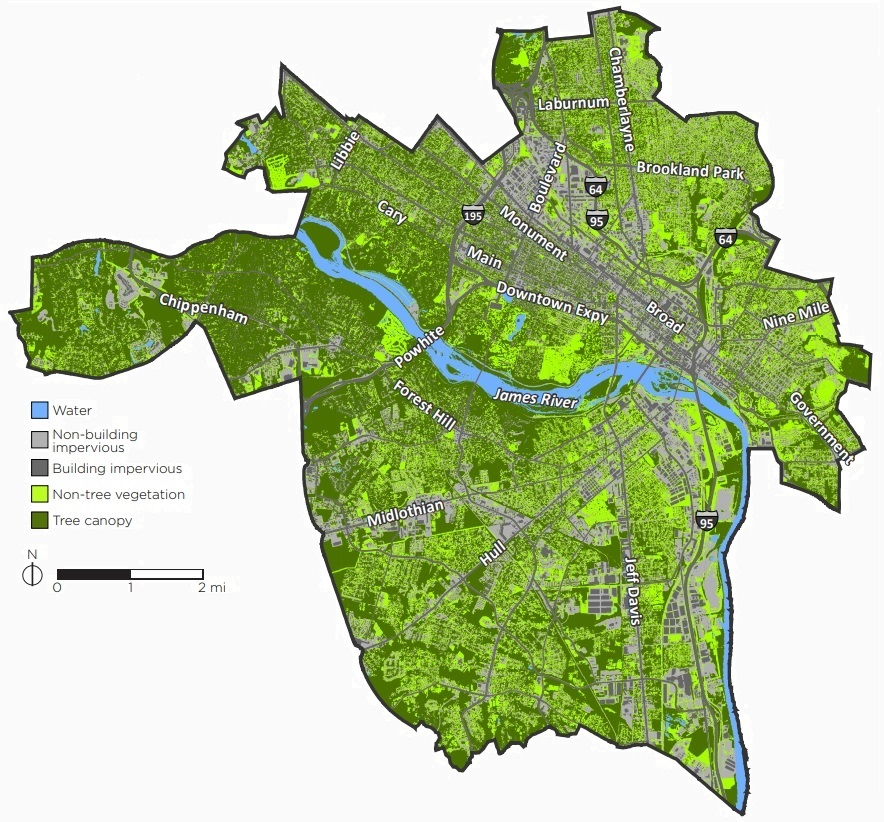
The partners conducted an initial mapping of urban heat islands in Richmond. The first image below shows different levels of developed landscape in Richmond. Areas that are gray have a high concentration of cement and asphalt (impervious surfaces). Impervious surfaces impede or prevent the natural infiltration of water into the soil. Light green areas on the image are primarily covered by plants and dark green areas are covered by trees. The second image shows the temperature of land surfaces one summer day in Richmond. The hotter temperatures are shades of red, while cooler temperatures are shades of blue.
Source: Richmond 300 Insights Report
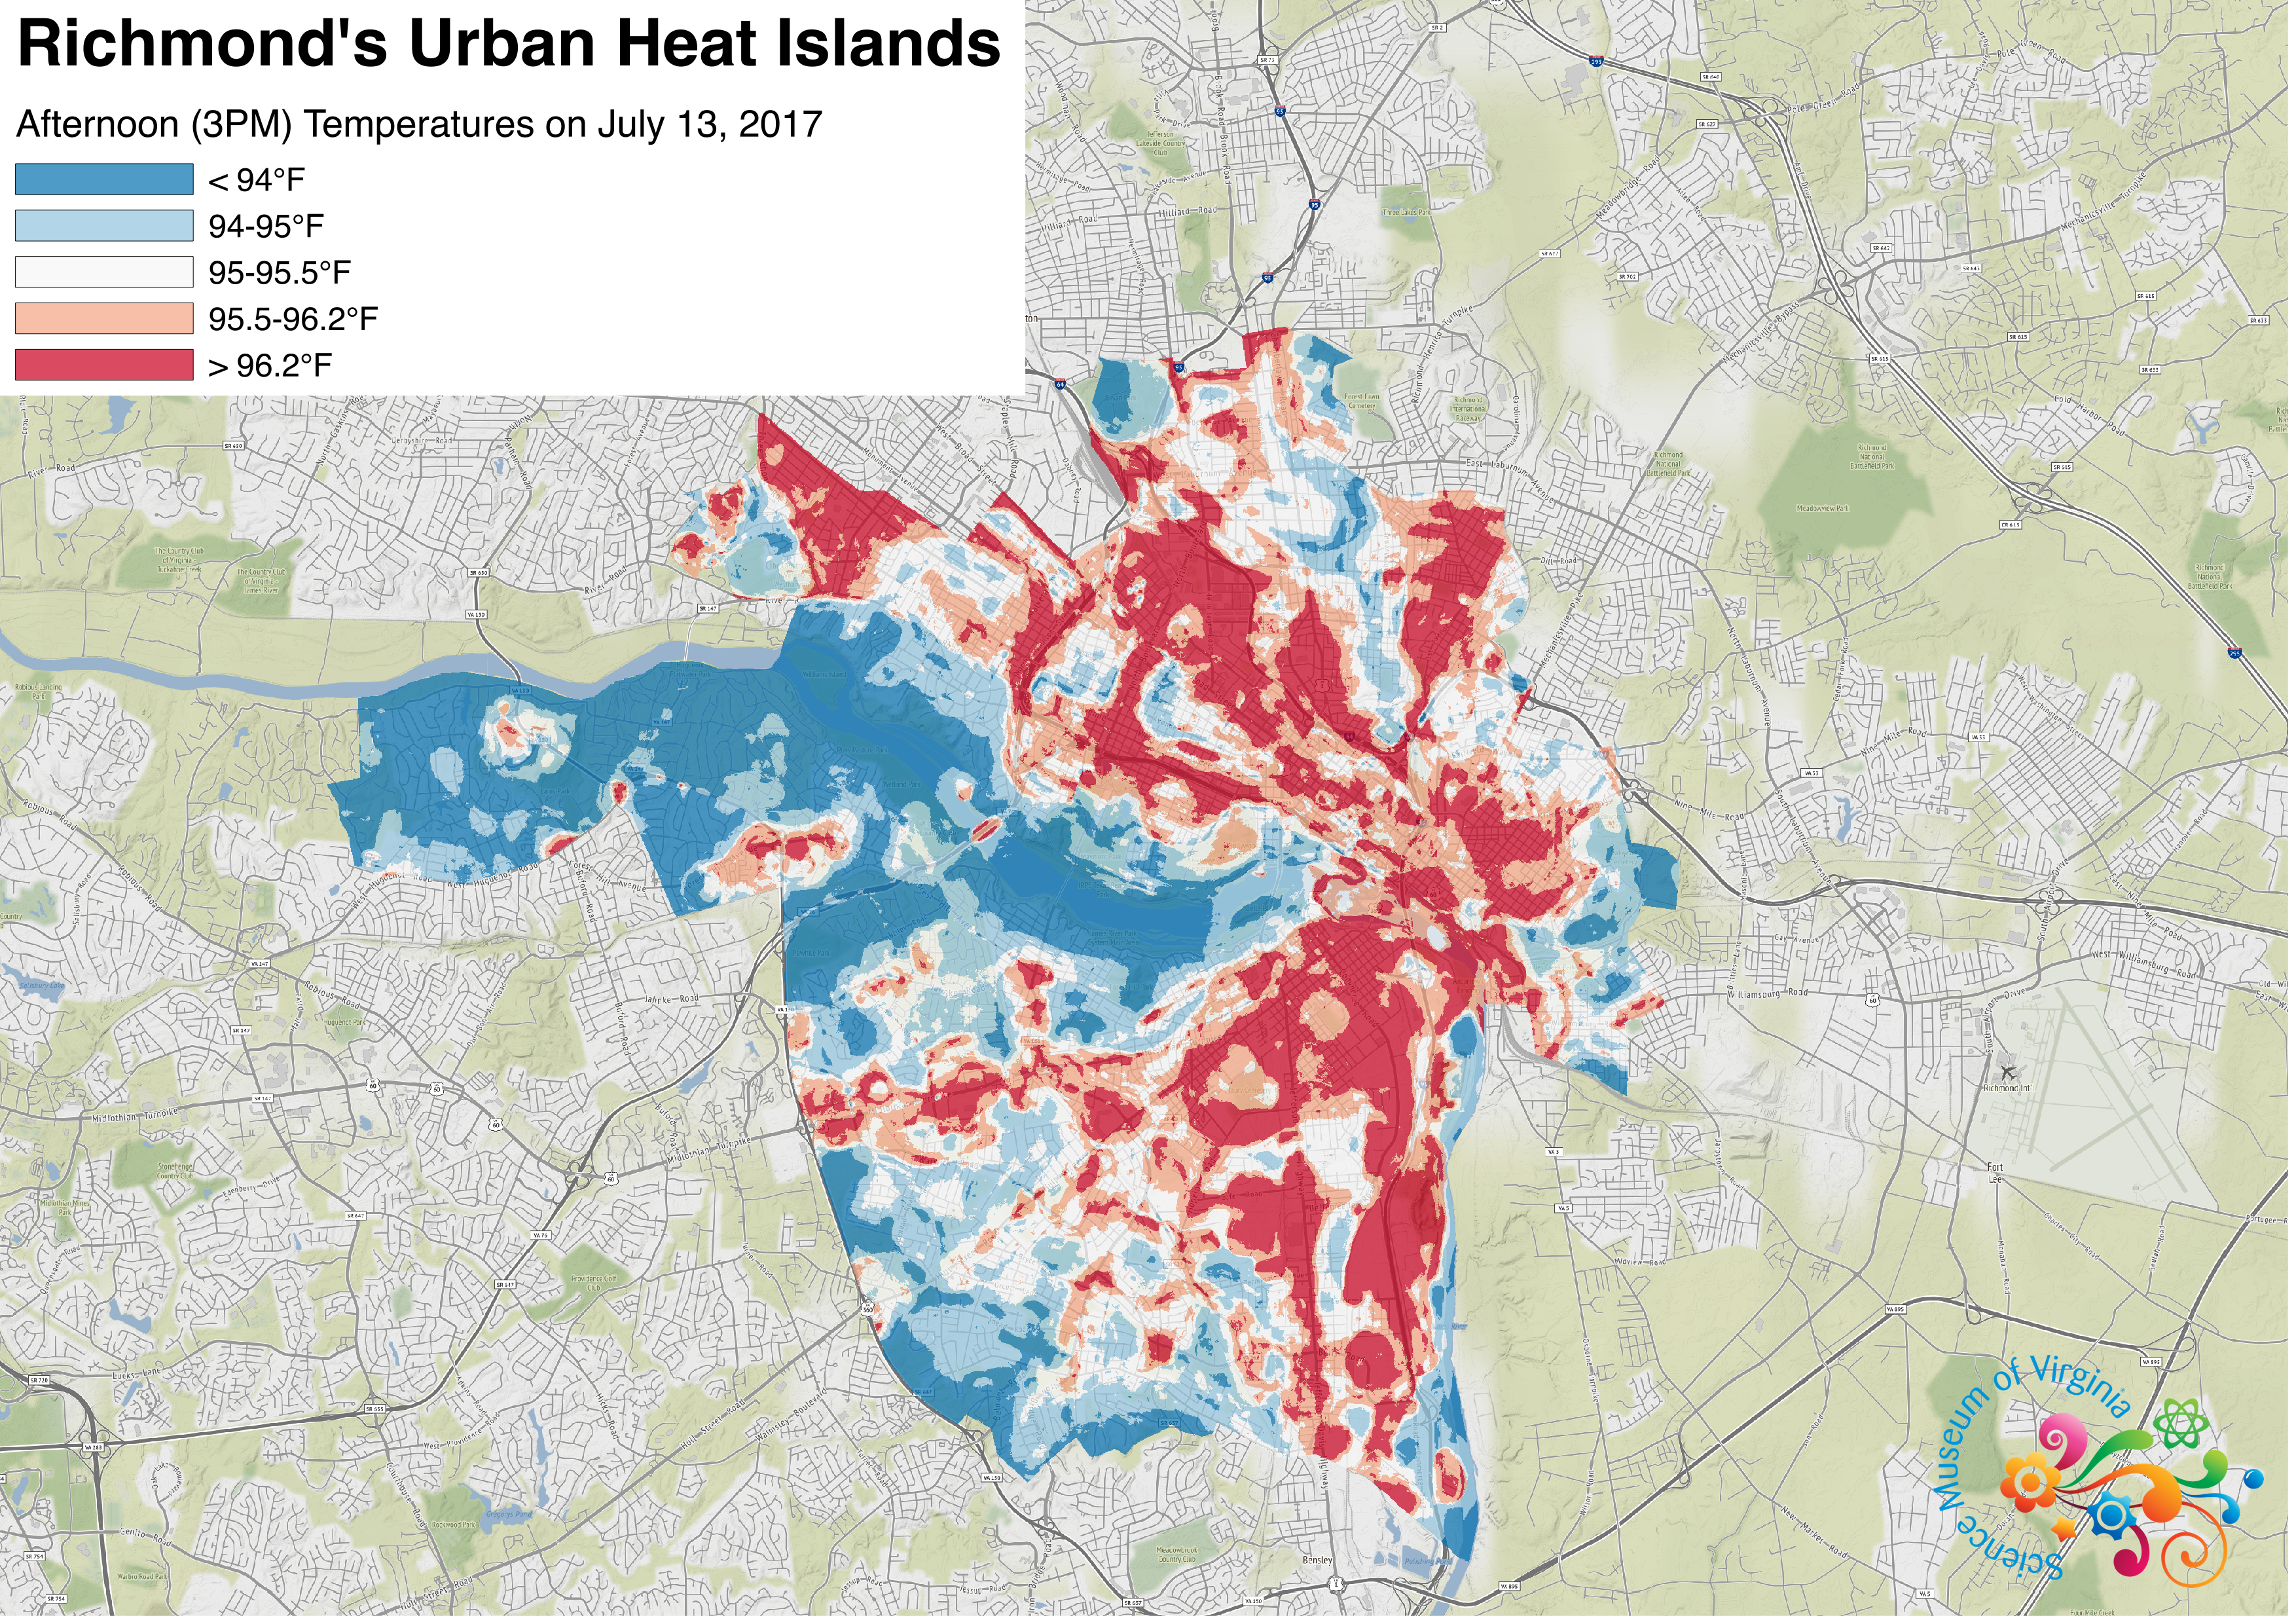
Source: Jeremy Hoffman, Science Museum of Virginia
Assessing Urban Heat Vulnerability
Extreme heat poses dangers to members of our community in different ways based on various demographic, health, and other factors. The City worked with the partners listed above to conduct an initial assessment of heat vulnerability in Richmond in 2017. In 2020, the City created this more comprehensive map. This heat vulnerability map incorporates the following:
- Poverty
- Age (children and elderly)
- Disability
- Working outdoors
- Vehicle access
- Housing status
- Housing cost burden
- Lack of central air conditioning
- Health conditions (COPD, heart disease, high blood pressure, asthma, diabetes, kidney disease, obesity)
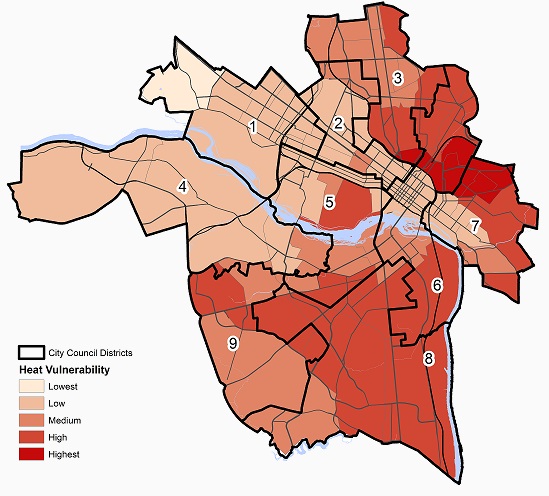
The RVAgreen 2050 equitable climate action and resilience planning initiative will prioritize engagement of the communities facing disparate impacts of urban heat.
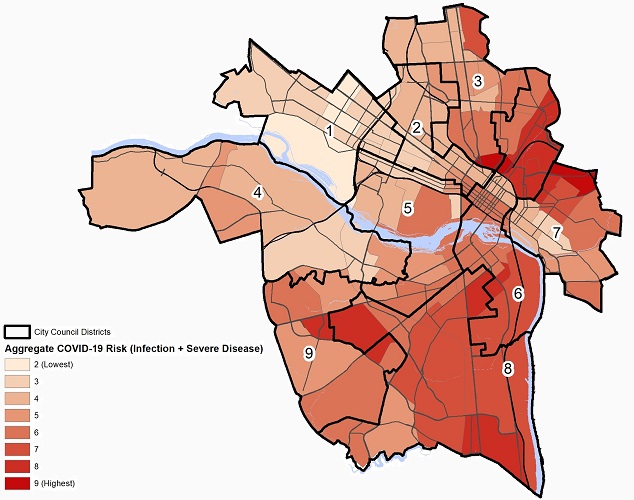
Comparing COVID-19 & Heat Vulnerability
The COVID-19 pandemic created a sudden public-health crisis with unprecedented impacts on the City of Richmond and our community. Climate change has been a slowly evolving public-health crisis. The people in our community who are most vulnerable to COVID-19 are the same people on the frontlines of climate change - those who are and will be impacted first and worst. The Office is using this data to identify and engage Richmond’s frontline communities in the RVAgreen 2050 equity-centered climate action and resilience planning initiative. Members of our community may be more or less at risk of COVID-19 infection and severe disease or fatality based on various factors. The COVID-19 vulnerability map below incorporates the following:
- Area of employment
- Commute mode (public transportation)*
- Poverty*
- Housing status*
- Limited English proficiency
- Pregnancy and breastfeeding
- Smoking
- Sex (male)
- Age (65+)*
- Health conditions (COPD, heart disease, high blood pressure, asthma, diabetes, kidney disease, obesity)*
- Access to healthcare and insurance
*These factors may also increase vulnerability to harm due to extreme heat.
Additional City Initiatives Addressing Urban Heat
The City of Richmond has several initiatives that are helping to mitigate urban heat and protect our community.
-
The Richmond 300 comprehensive planning process has identified many draft strategies addressing urban heat islands, tree canopy, stormwater management, and impervious surface reduction.
-
The City is working with the Alliance for the Chesapeake Bay to further the goals of RVAH2O by developing a comprehensive green infrastructure master plan to capture and treat polluted stormwater runoff by converting impervious surfaces to pervious surfaces, planting trees and native plants, installing bioretention, permeable pavement systems, and other innovative green stormwater practices that will also mitigate the urban heat island effect.
-
The Department of Parks, Recreation and Community Facilities has opened streets to bicyclists and pedestrians in and around Byrd Park and Chimborazo Park to allow social distancing for those visiting the area during COVID-19.
-
The Urban Forestry Division has information on tree planting initiatives and metrics.
-
The City of Richmond works with Capital Trees and other community partners to build green infrastructure projects like the Low Line Gardens and Low Line Green that also help to reduce the urban heat island effect.
Stay Cool and Safe!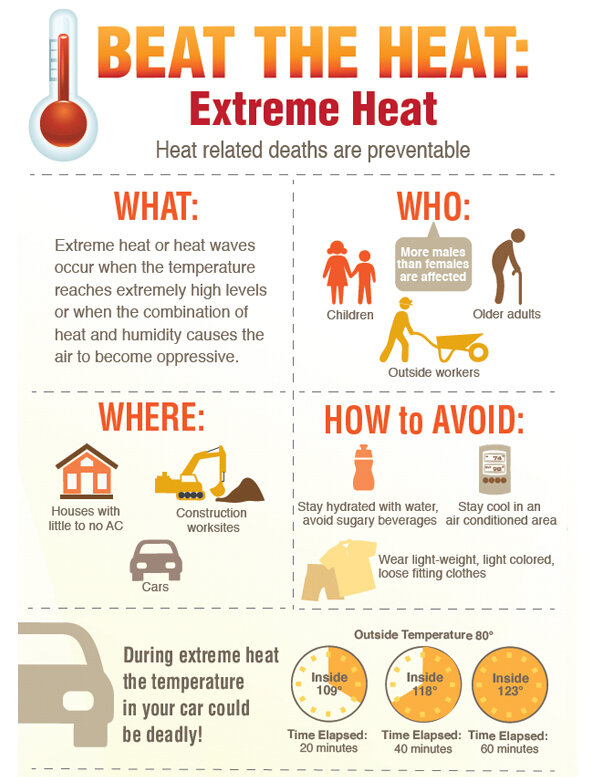
The City of Richmond opens cooling stations when the temperature and/or heat index is expected to reach or exceed 95 degrees. Call 311 for current cooling station locations.
During COVID-19: All citizens must wear face coverings while in the building and maintain a safe physical distance of six feet from others. Seating will be arranged for the appropriate social distancing. (Pets, with the exception of service animals, are not permitted).
For more information regarding cooling assistance services, city residents should contact the City’s Department of Social Services Fuel Assistance Office at (804) 646-7046. Elderly residents with cooling related issues should contact Adult Services at (804) 646-7367. In the event of a heat related emergency, please call 9-1-1.
Virginia’s Cooling Assistance Program is available to households with a child under six years old, a person with disabilities, or an adult age 60 or older living in the home who meet the program’s income and eligibility requirements.
What is Energy Burden?
| Richmond, VA Housing Quick Facts: Drivers of Energy Burden (2018) | |
|---|---|
|
Population of Color (all except White Non-Hispanic or Latino)
|
51% |
| Population Renting Housing | 56% |
| Households with Income 50% or Less than Area Median Income (AMI: $48,947) | 106% |
| Percentage of Housing Stock Built Before 1980 | 82% |
| Total Households | 91,359 |
| Total Housing Stock | 100,005 |
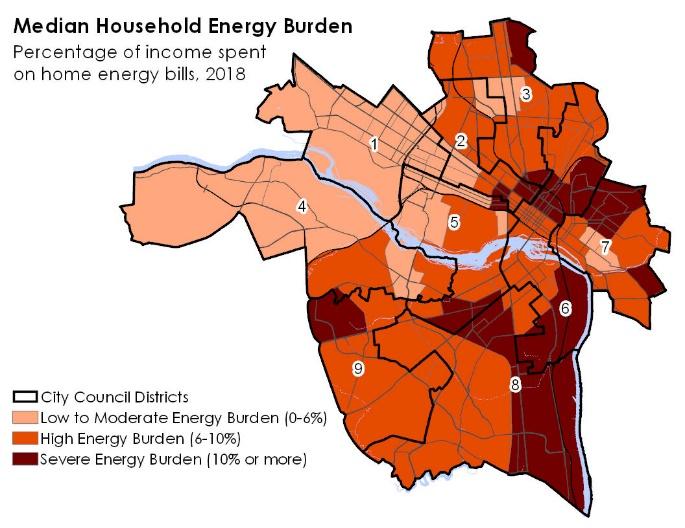
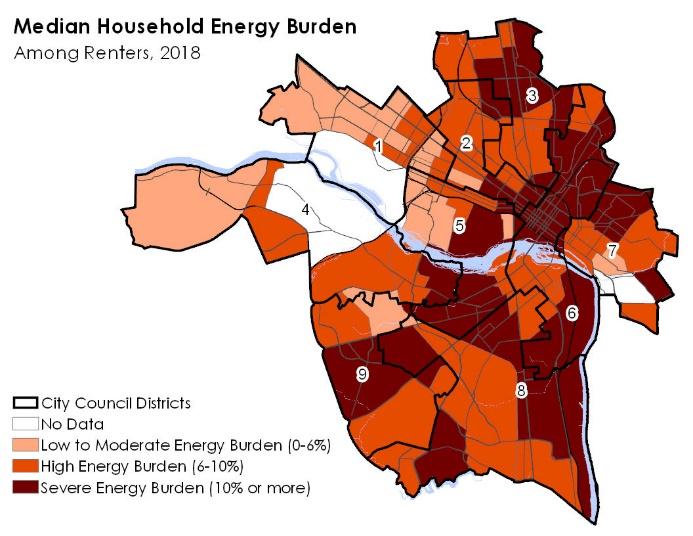
Energy burden represents the percentage of annual income that a household or individual pays towards their energy bills (electricity and/or natural gas). A household is typically considered in “high burden” if their energy burden exceeds 6% of their annual income and in “severe burden” or “energy poverty” if their bills exceed 10%. The citywide median household energy burden is 7.68%. The median energy burden across the 48 largest U.S. cities (including Richmond) is 3.5%. (ACEEE report). Drivers of energy burden include the dwelling’s physical characteristics, the household’s socio-economic status and behavior patterns and available resources (ACEEE report).

| Energy Burden Information (2018) | Richmond |
|---|---|
| Average annual electricity cost per household | $773 |
| Average annual gas cost per household | $292 |
| Average annual water cost per household | $248 |
| % of population at or above 6% energy burden (high) | 46% |
| % of population at or above 10% energy burden (severe) | 43% |
Energy Burden and Eviction
From the Virginia Poverty Law Center Affordable Clean Energy Project:
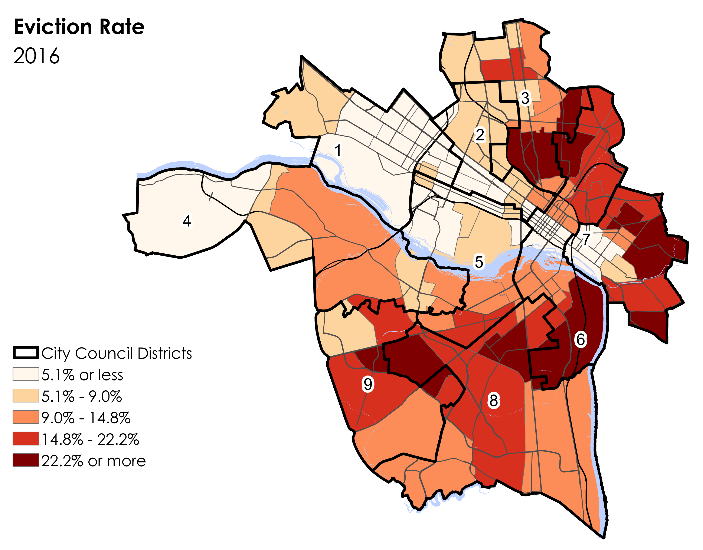
…Richmond made headline news when a story in the New York Times reported that Virginia’s capitol city had one of the highest eviction rates in the country. Electricity burden is a known contributing factor to evictions. Families with limited income are sometimes forced to choose between paying their electric bill or paying the rent.
Energy efficiency is a least cost measure that can help low-income households reduce their electricity burden here in Virginia. Often, low-income households are already using less electricity than the average Virginian household simply because of the size of their homes; however, the structural condition of these homes increases the energy burden because the energy cost per square foot is greater. Per Energy Information Administration (EIA) data, a low-income household spends on average $1.23 per square foot for utilities, while a non-low-income household will spend $0.98 per square foot.
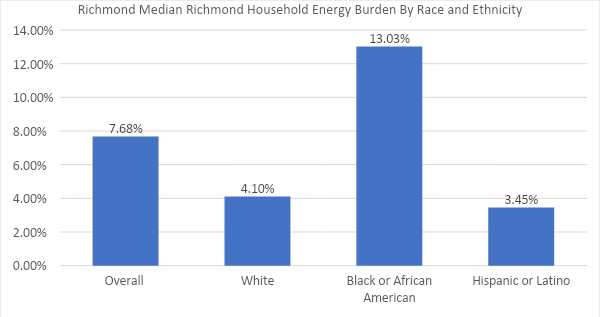
Low-income households, Black, and Hispanic or Latino households pay a much larger share of their income on energy bills (ACEEE report). This puts them at higher risk of utility shutoffs and evictions, particularly during crises such as the COVID-19 pandemic.
| Energy Burden: Total Households | Energy Burden: White Households |
| Energy Burden: Black or African American Households | Energy Burden: Hispanic or Latino Households |


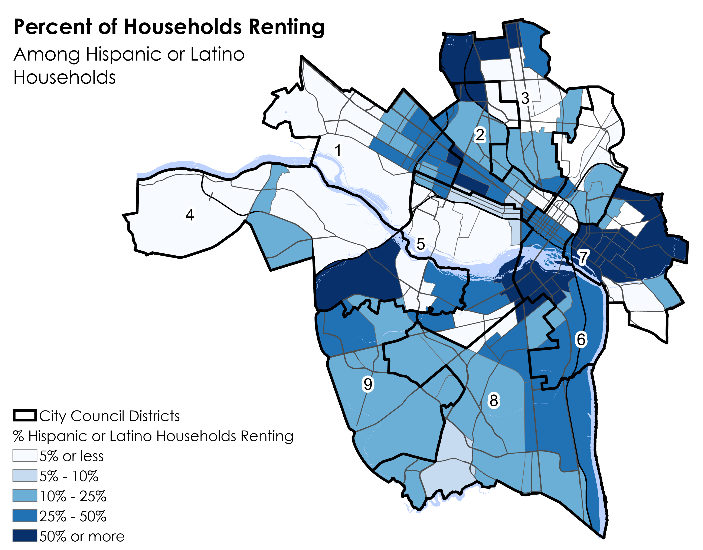
Among Richmond’s racial and ethnic communities, a higher proportion of Black and African American and Hispanic and Latino households are renters than White Non-Hispanic or Latino households. A 2016 study found that Black, Hispanic or Latino, and lower-income households living in multifamily dwellings or rental housing are more likely to spend a greater share of their income on energy bills than other households.
| Renting: White Residents | Renting: Black or African American Residents |
| Renting: Hispanic or Latino Residents | Energy Burden: Renters |


Energy efficiency is a least cost measure that can help low-income households reduce their electricity burden here in Virginia. Often, low-income households are already using less electricity than the average Virginian household simply because of the size of their homes; however, the structural condition of these homes increases the energy burden because the energy cost per square foot is greater. Per Energy Information Administration (EIA) data, a low-income household spends on average $1.23 per square foot for utilities, while a non-low-income household will spend $0.98 per square foot.
Housing & Urban Heat
An urban heat island (UHI) is an urban area that is significantly warmer than its surrounding rural areas. Modified land surfaces (paving, sidewalks, streets, etc.) in the urban environment retain heat and are the main cause of UHI. In Richmond, the UHI is strongest in the summer months. When combined with summer weather, the UHI can create periods of extremely high temperatures and humidity levels that have serious health impacts on vulnerable members of our community (people with asthma and pulmonary conditions, the elderly, etc.). As extreme heat events increase with climate change, the urban heat island is projected to intensify.
In summer of 2017, the City of Richmond partnered with the Science Museum of Virginia, Virginia Commonwealth University, University of Richmond, and Groundwork RVA to measure and map the city’s urban heat island.
How do higher temperatures from urban heat islands impact our community?
- Negatively affect our health and comfort
- Elevate level of air pollutants and greenhouse gas emissions
- Higher energy bills
- Increase energy consumption in buildings
- Impair water quality
The City worked with the partners listed above to conduct an initial assessment of heat vulnerability in Richmond in 2017. In 2020, the City created this more comprehensive map.

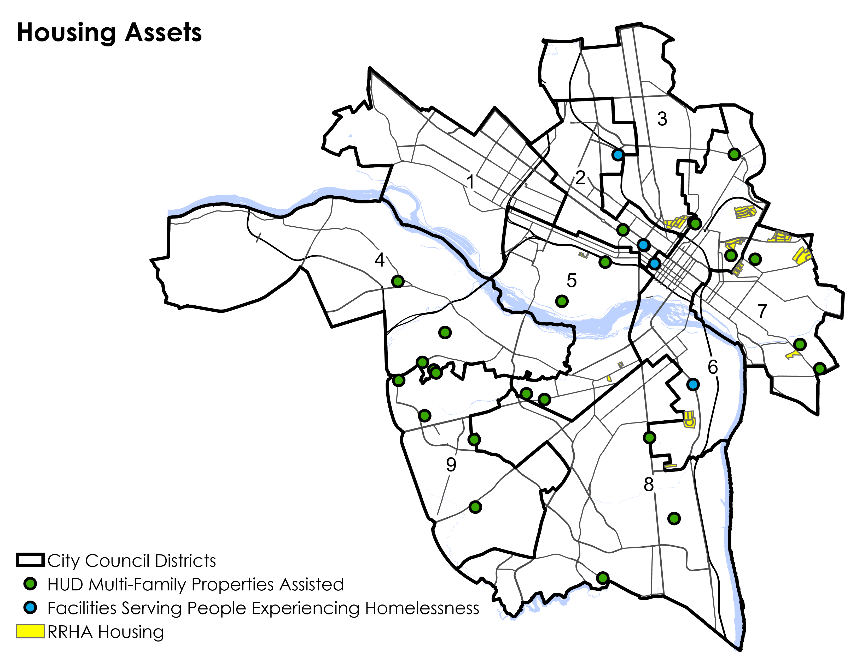
Many of Richmond’s existing housing assets and facilities that serve lower income residents and people experiencing homelessness are located in the same areas that experience higher urban heat, higher heat vulnerability, and areas with more households facing high or severe energy burden. This shows a pattern of placing these housing resources in certain areas of the city.
The urban heat island effect is strongest in some of the same neighborhoods where households experience high energy burden and eviction rates. These hotter temperatures may cause households to use more energy – and therefore have higher energy bills – to keep their homes cool and safe. Lower income households may also live in less efficient and less weatherized homes, further increasing their need to use more energy to keep cool during extreme heat events.

Many of Richmond’s existing housing assets and facilities that serve lower income residents and people experiencing homelessness are in areas of higher heat vulnerability. These areas lack cooler green spaces which offer a “variety of mental, physical and social benefits for humans, ranging from stress reduction, quicker healing, and mitigation of Attention Deficit Disorder in children to decreasing crime and air pollution.”